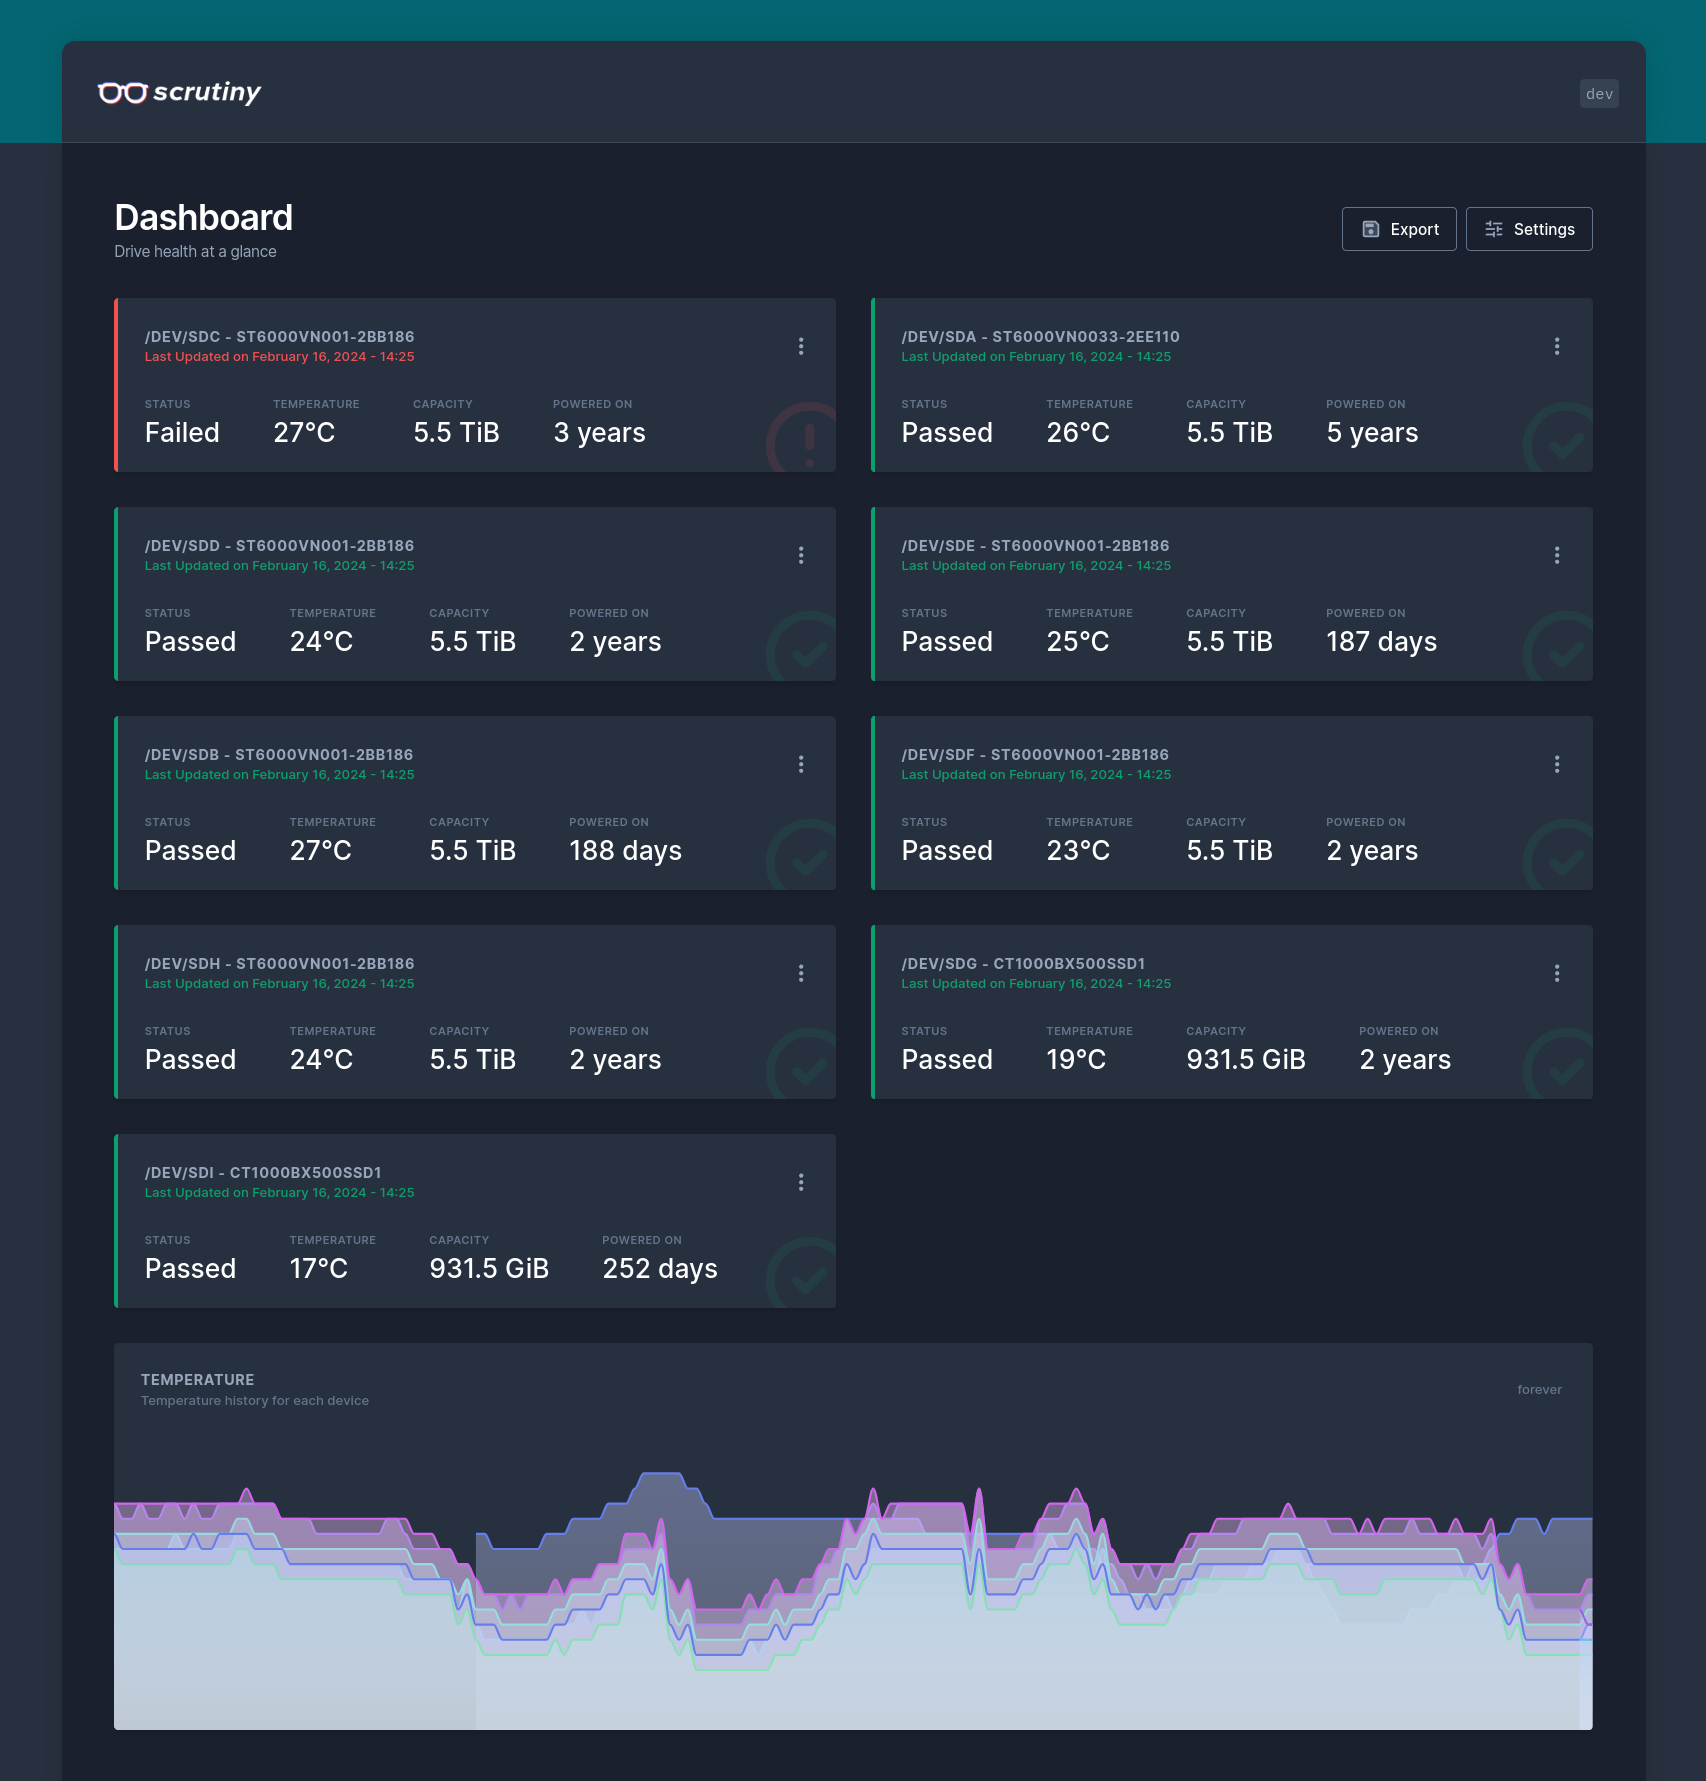
In a recent (well, recent-ish) episode of the Self Hosted Show, there was some talk of a hard drive monitoring tool called Scrutiny. Scrutiny is a hard drive monitoring tool that exposes S.M.A.R.T data in a nice, clean dashboard. It gathers that S.M.A.R.T data using the venerable smartd, which is a Linux daemon that monitors S.M.A.R.T data from a huge number of ATA, IDE, SCSI-3 drives. The code is available on Github.
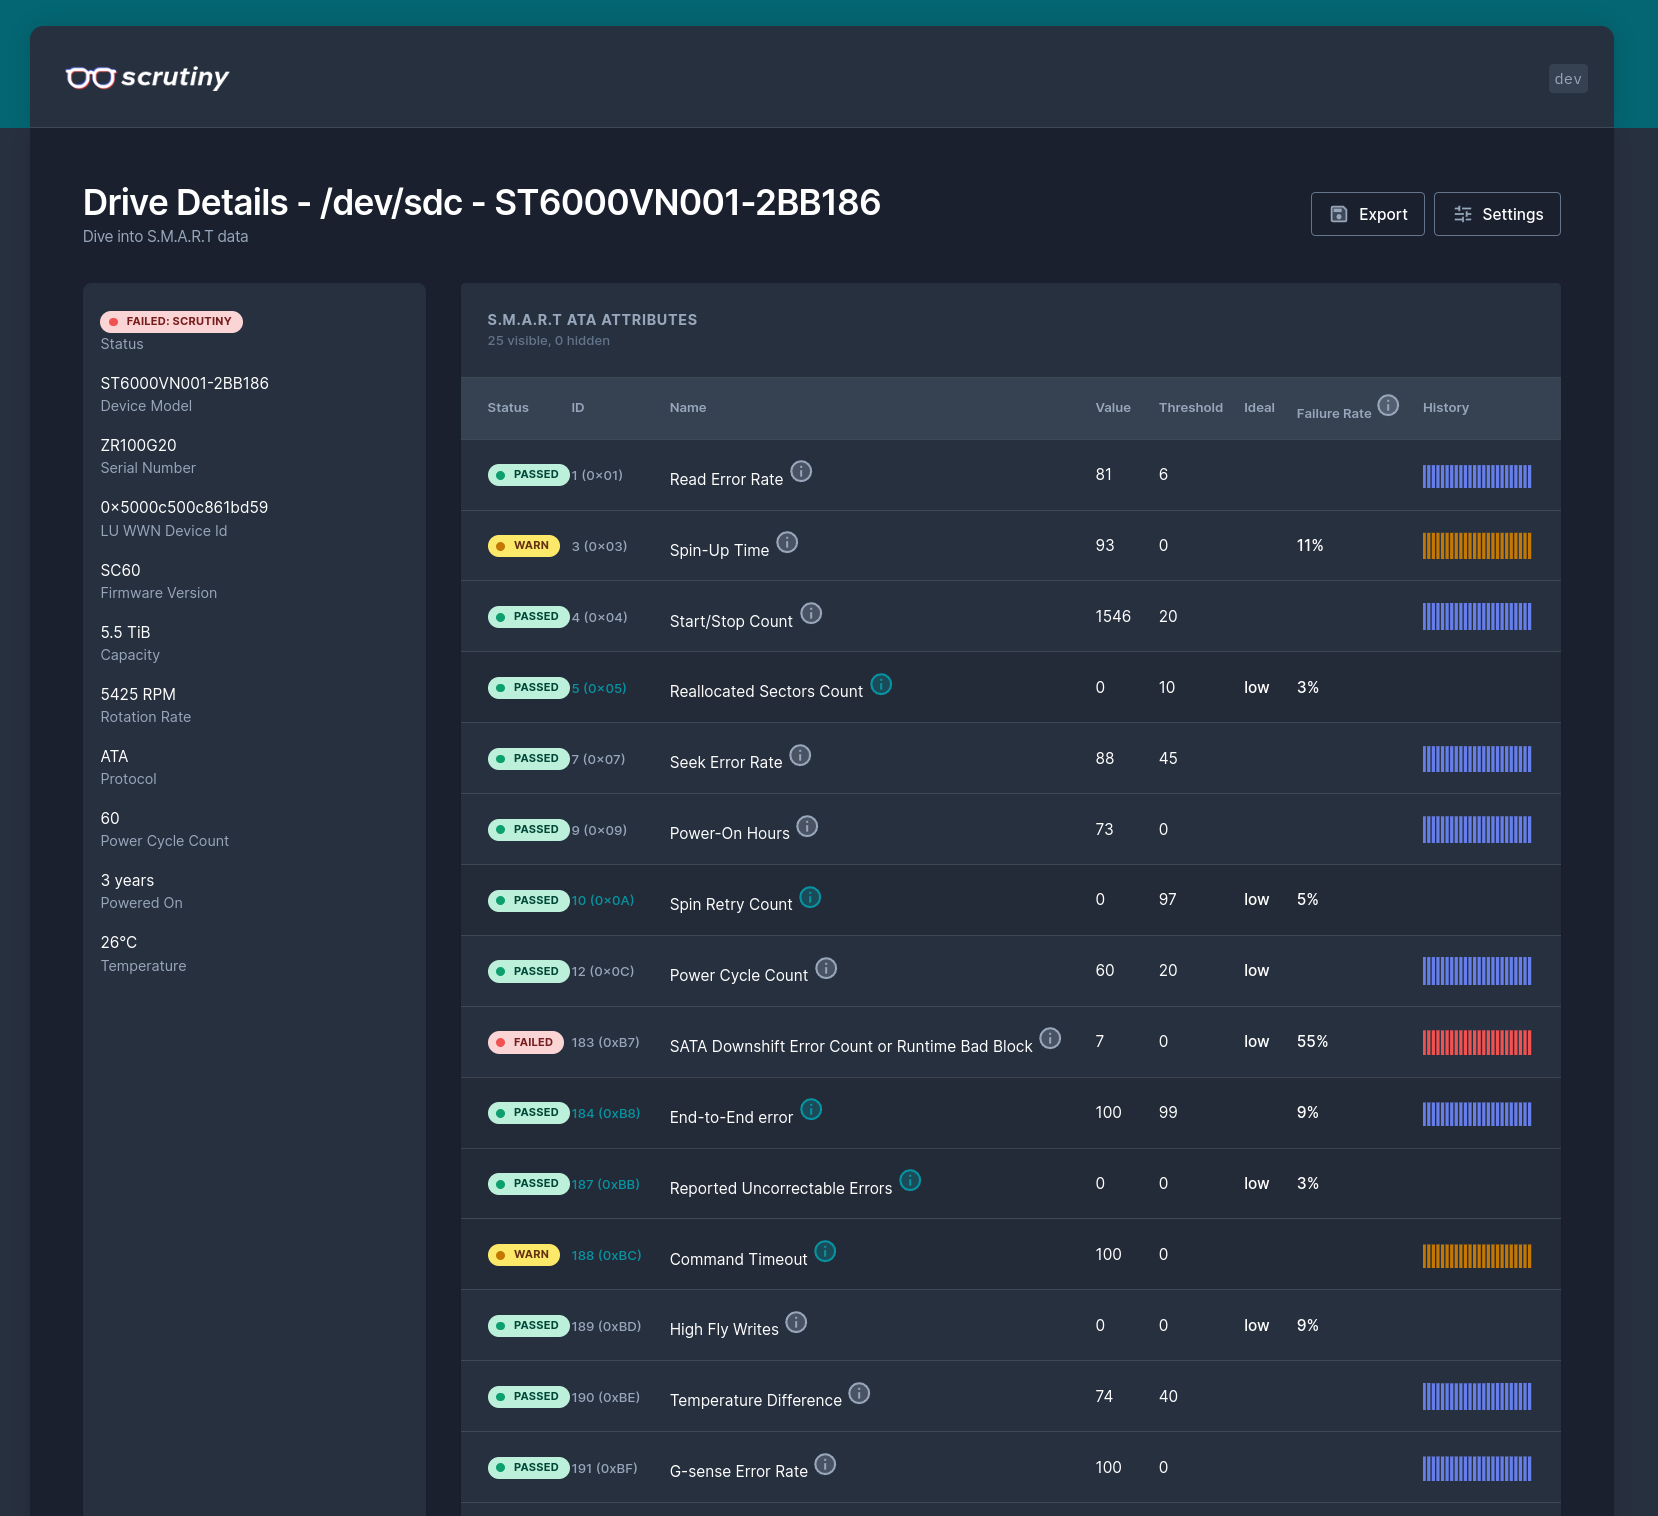
The aim of running such monitoring is to detect and replace failing hard drives before they cause an outage, or any data loss. Depending on the firmware of a drive, there are potentially hundreds of S.M.A.R.T attributes that can be collected, so it can be hard to understand which to pay attention to.
As good as smartd is, it has some shortcomings such as not recording historical data for each attribute, and relying upon value thresholds that are set by the manufacturers of the drive. Scrutiny aims to provide historical tracking of attribute readings, and thresholds based on real-world data from Backblaze.
This all looked very compelling, but it hasn’t been packaged for NixOS as far as I can tell. This post is quite “code heavy” and is intended as a bit of a deep-dive/walkthrough for people who are new to packaging in Nix. I’m certainly no expert here, and if you spot something I’ve done wrong - I’d love to hear about it!
The web application is the dashboard that you’ll see the pretty screenshots of. The collector service is designed to be run on an interval to collect information from smartd, and send it to the web application’s API.
Scrutiny relies upon InfluxDB to store data about smart attributes in a timeseries.
Thinking about how to structure things, I decided that I would build two separate Nix packages: one for the dashboard and UI, and another for the collector. It seems one could run the collector and dashboard on different machines, so this seemed like a logical split.
I decided to start with the web application. Because of how the project is laid out, this means combining two separate derivations based built from the same source code: one for the UI and one for the backend. I began by creating a file that would carry common attributes for each of the derivations, such as the version, repository information, hash, etc.
# common.nix{pkgs,...}:letname="scrutiny";version="0.7.2";in{inheritnameversion;# Fetch the source code from Github, referring to# the version required by Git tag.repo=pkgs.fetchFromGitHub{owner="AnalogJ";repo=name;rev="v${version}";sha256="sha256-UYKi+WTsasUaE6irzMAHr66k7wXyec8FXc8AWjEk0qs=";};# ...}
{pkgs,...}:{# Import some common attributes such# as name, version, src repocommon=import./common.nix{inheritpkgs;};inherit(common)nameversionrepovendorHash;# Create a package for the Javascript frontendfrontend=pkgs.buildNpmPackagerec{inheritversion;pname="${name}-webapp-frontend";src="${repo}/webapp/frontend";# This hash is generated at build time, and uniquely identifies# the cache of NodeJS dependencies used for the build.npmDepsHash="sha256-M8P41LPg7oJ/C9abDuNM5Mn+OO0zK56CKi2BwLxv8oQ=";# Override the build phase to match the# upstream build process.buildPhase=''
runHook preBuild
mkdir dist
npm run build:prod --offline -- --output-path=dist
runHook postBuild
'';# Copy the output of the compiled javascript bundle# and site assets to the package output.installPhase=''
runHook preInstall
mkdir $out
cp -r dist/* $out
runHook postInstall
'';};# ...}
This is a relatively simple derivation, mostly thanks to the magic of the buildNpmPackage function. This helper function takes care of creating an offline cache containing all of the NodeJS dependencies required to build the frontend. Nix builds are always done in an offline environment to help ensure reproducibility, so source code and dependencies are fetched (and hashed) early in the process before any software is actually built.
I chose to override the build phase to match the process used by the upstream Makefile. The result of this derivation is a package named scrutiny-webapp-frontend, which contains just the built output from the npm run build:prod command.
Next up was the dashboard backend. Another pleasingly simple derivation thanks to some help from buildGoModule:
pkgs.buildGoModulerec{# The vendor hash is used for multiple packages, and# thus centralised and imported here.inheritversionvendorHash;pname="${name}-webapp-backend";# Use the source block defined in 'common.nix'src=repo;CGO_ENABLED=0;# Override the build phase to ensure the correct# binary is built. This project ships both Go applications# and the NodeJS frontend in the same repository, so some# specificity is required.buildPhase=''
runHook preBuild
go build \
-o scrutiny-web \
-ldflags="-extldflags=-static" \
-tags "static netgo" \
./webapp/backend/cmd/scrutiny
runHook postBuild
'';# Add the built binary to the package output, as well# as the build output from the frontend.installPhase=''
mkdir -p $out/bin $out/share/scrutiny
cp scrutiny-web $out/bin/scrutiny-web
cp -r ${frontend}/* $out/share/scrutiny
'';}
This one is a little more interesting. There are some commonalities, such as setting the vendorHash to ensure the correct Go dependencies are used (imported from common.nix in this case), and overriding the build to match the upstream process and ensure the right binary is built.
Where things differ is in the install phase, where the contents of the scrutiny-webapp-frontend derivation is copied into the output of this derivation - which will ultimately result in a single Nix package (named scrutiny-webapp-backend) which will contain both the frontend and backend components of the application. This is ultimately exposed in an overlay as a package simply named scrutiny.
You can see the finished product (with additional package metadata) in app.nix and common.nix on Github.
The collector is just a single, statically compiled Go binary, and as such the derivation very much resembles that of the web application backend above:
{pkgs,lib,...}:let# Again import common attributes from 'common.nix'common=import./common.nix{inheritpkgs;};inherit(common)nameversionrepovendorHash;inpkgs.buildGoModulerec{inheritversionvendorHash;pname="${name}-collector";src=repo;# We'll create a wrapper script for the# collector, which makeWrapper helps with.buildInputs=withpkgs;[makeWrapper];CGO_ENABLED=0;# Override the build phase to ensure the correct# binary is built.buildPhase=''
runHook preBuild
go build \
-o scrutiny-collector-metrics \
-ldflags="-extldflags=-static" \
-tags "static netgo" \
./collector/cmd/collector-metrics
runHook postBuild
'';# Install both the binary, and a generated wrapper script# which ensures that 'smartctl' is in the PATH of the collector.installPhase=''
mkdir -p $out/bin
cp scrutiny-collector-metrics $out/bin/scrutiny-collector-metrics
wrapProgram $out/bin/scrutiny-collector-metrics \
--prefix PATH : ${lib.makeBinPath[pkgs.smartmontools]} '';}
Of interest here is the installPhase. The collector works by invoking smartctl to scrape information from smartd. Scrutiny itself expects that tool to be readily available in it’s PATH, and to accomplish that I used the makeWrapper package to create a wrapper script that ensures scrutiny-collector-metrics is executed with the PATH correctly set such that smartctl can be found.
The final derivation for the collector can be seen in collector.nix on Github.
While I now had functioning packages for all of Scrutiny’s components, for them to function correctly on a machine there are a few things that need to be in place:
The dashboard package must be installed and started
The collector collector package must be installed and started
InfluxDB must be installed and started
Scrutiny dashboard must be configured to speak to the host’s InfluxDB
smartd must be installed and running
This sort of challenge is exactly what the NixOS modules system aims to solve. Modules take a set of configuration attributes, and convert them into rendered system configuration in the form of systemd units, configuration files and more.
It’s tempting to try to support all possible configurations when writing a module, but I generally prefer to start small, and support only the configuration I need for my use-case. This keeps things easy to test (and leaves some fun for the future!). In this case, the module would be first installed on a server which hosts a set of services behind the Traefik reverse proxy. To work out what configuration I wanted to provide, I looked at the upstream’s example config file. The important things that stood out to me for consideration were:
The location of the web UI files to serve
The host/port of the InfluxDB instance
The “base path” - Scrutiny will be exposed at https://<tailscale node>/scrutiny
As mentioned before - each NixOS module consists of some options, and some rendered config. The options block for my Scrutiny web app looks like the below snippet. I’ve omitted comments this time, as I think the language is quite descriptive here:
{letcfg=config.services.scrutiny;inoptions={services.scrutiny={enable=lib.mkEnableOption"Enables the scrutiny web application";# Use the `scrutiny` package by default.package=lib.mkPackageOptionMDpkgs"scrutiny"{};port=lib.mkOption{type=lib.types.port;default=8080;description=lib.mdDoc"Port for web application to listen on";};host=lib.mkOption{type=lib.types.str;default="0.0.0.0";description=lib.mdDoc"Interface address for web application to bind to";};basepath=lib.mkOption{type=lib.types.str;default="";description=lib.mdDoc''
If Scrutiny will be behind a path prefixed reverse proxy, you can override this
value to serve Scrutiny on a subpath.
Do not include the leading '/'.
'';};openFirewall=lib.mkOption{type=lib.types.bool;default=false;description="Open the default ports in the firewall for Scrutiny.";};logLevel=lib.mkOption{type=lib.types.enum["INFO""DEBUG"];default="INFO";description=lib.mdDoc"Log level for Scrutiny.";};};};}
This provides some basic configuration for the attributes I care about - noticeably missing is any advanced configuration for InfluxDB (such as org, bucket, token), and and any ability to configure notifications which Scrutiny supports through the excellent shoutrrr library. These things will come later.
I needed a convenient way to convert this Nix-native configuration format into the right format for Scrutiny - I wrote a small Nix function to help with that, which takes configuration elements from the options defined above, and writes them into a small YAML file:
{config={# If scrutiny is enabled, also enable InfluxDB with default settingsservices.influxdb2=lib.mkIfcfg.enable{enable=true;};# Open the relevant ports in the system firewall if configurednetworking.firewall=lib.mkIfcfg.openFirewall{allowedTCPPorts=[cfg.port];};# If Scrutiny is enabled, create a systemd unit to start itsystemd={services={scrutiny=lib.mkIfcfg.enable{description="Hard Drive S.M.A.R.T Monitoring, Historical Trends & Real World Failure Thresholds";wantedBy=["multi-user.target"];after=["network.target"];serviceConfig={# Don't run the application a root - create a dynamic user as it startsDynamicUser=true;# Start the application with a config rendered by the helper functionExecStart="${cfg.package}/bin/scrutiny-web start --config ${mkScrutinyCfgcfg}";Restart="always";StateDirectory="scrutiny";StateDirectoryMode="0750";};};};};};}
That’s enough to get the dashboard started, but it doesn’t take care of starting the collector. For that, I added a couple more configuration options to the module:
{letcollectorCfg=config.services.scrutiny.collector;in{options={services.scrutiny={# ...collector={enable=lib.mkOption{type=lib.types.bool;default=cfg.enable;description=lib.mdDoc"Enables the scrutiny collector";};# Use the `scrutiny-collector` package by default.package=lib.mkPackageOptionMDpkgs"scrutiny-collector"{};endpoint=lib.mkOption{type=lib.types.str;default="http://${cfg.host}:${builtins.toStringcfg.port}/${cfg.basepath}";description=lib.mdDoc"Scrutiny app API endpoint for sending metrics to.";};interval=lib.mkOption{type=lib.types.str;default="15m";description=lib.mdDoc''
Interval on which to collect information about disks.
Examples: 15m, 10s, 2h.
'';};};};};}}
With that configuration in place, I needed to adjust the rendered configuration to include starting the collector. The collector is designed to run on an interval to post metrics to the dashboard. The upstream achieves this with cron, but I decided to use systemd timers:
{config={# ...# If the collector is enabled, enable smartd so that the# collector can scrape metrics from itservices.smartd={enable=collectorCfg.enable;extraOptions=["-A /var/log/smartd/""--interval=600"];};systemd={services={# Setup a systemd unit to start the collectorscrutiny-collector=lib.mkIfcollectorCfg.enable{description="Scrutiny Collector Service";environment={COLLECTOR_API_ENDPOINT="${collectorCfg.endpoint}";};serviceConfig={Type="oneshot";ExecStart="${cfg.collector.package}/bin/scrutiny-collector-metrics run";};};};# Set up a systemd timer to trigger the collector at an# interval (default 15m).timers={scrutiny-collector=lib.mkIfcollectorCfg.enable{timerConfig={OnBootSec="5m";OnUnitActiveSec="${collectorCfg.interval}";Unit="scrutiny-collector.service";};};};};};}
And that’s it! You can see the final module all stitched together on Github.
To me, a super exciting part of the NixOS ecosystem is its automated testing framework, which is used to great effect for testing hundreds of packages end-to-end before they’re released to the various NixOS channels. The NixOS testing framework provides a set of helpers for spawning fresh NixOS virtual machines, and ensuring that applications can start, services have the right side effects, etc.
I wanted to write a simple test to validate that Scrutiny will continue to work as I update my flake. In my view, the test needed to:
Ensure that the packages could be built
Ensure that when services.scrutiny.enable = true is set, the services start
Ensure that the dashboard app renders the UI
Ensure that the metrics collector can speak to the dashboard
Most of these are relatively trivial - one piece that’s a little harder is testing that the UI renders correctly. The application is rendered using Javascript client-side, so a simple curl won’t get us the results we’re expecting. I had previously used selenium for this purpose when I submitted a test for the LXD UI, so I chose to use that approach again.
{name="scrutiny";nodes={# Configure a NixOS virtual machine for the testmachine={self,pkgs,lib,...}:{# Ensure that my NixOS module is importedimports=[self.nixosModules.scrutiny];# Add the package overlay from my flake so that `pkgs.scrutiny` resolves.nixpkgs.overlays=[self.outputs.overlays.additions];# Configure the VM to use my module and enable itservices.scrutiny.enable=true;environment.systemPackages=let# A selenium script that fetches the dashboard using geckodriverseleniumScript=pkgs.writers.writePython3Bin"selenium-script"{libraries=withpkgs.python3Packages;[selenium];}''
from selenium import webdriver
from selenium.webdriver.common.by import By
from selenium.webdriver.firefox.options import Options
from selenium.webdriver.support.ui import WebDriverWait
options = Options()
options.add_argument("--headless")
service = webdriver.FirefoxService(executable_path="${lib.getExepkgs.geckodriver}") # noqa: E501
driver = webdriver.Firefox(options=options, service=service)
driver.implicitly_wait(10)
driver.get("http://localhost:8080/web/dashboard")
wait = WebDriverWait(driver, 60)
# Look for some elements that should be rendered by the Javascript bundle in the UI
assert len(driver.find_elements(By.CLASS_NAME, "mat-button-wrapper")) > 0
assert len(driver.find_elements(By.CLASS_NAME, "top-bar")) > 0
driver.close()
'';inwithpkgs;[curlfirefox-unwrappedgeckodriverseleniumScript];};};# This is the test code that will check if our service is running correctly:testScript=''
start_all()
# Wait for InfluxDB to be available
machine.wait_for_unit("influxdb2")
machine.wait_for_open_port(8086)
# Wait for Scrutiny to be available
machine.wait_for_unit("scrutiny")
machine.wait_for_open_port(8080)
# Ensure the API responds as we expect
output = machine.succeed("curl localhost:8080/api/health")
assert output == '{"success":true}'
# Start the collector service to send some metrics
collect = machine.succeed("systemctl start scrutiny-collector.service")
# Ensure the application is actually rendered by the Javascript
machine.succeed("PYTHONUNBUFFERED=1 selenium-script")
'';}
This relatively short code snippet will take care of:
Building a dedicated virtual machine according to the machine spec
Starting the VM
Running the tests inside the VM (specified in `testScript)
Collecting the results
I ended up adding this check in a Github Actions workflow so that it’s run each time I make a change to my flake.
You can give this a go too! If you’ve got a NixOS machine, or perhaps a virtual machine you’ve been experimenting with, then you need only add the following to your flake:
# Where 'inputs' is the inputs attribute of your flake{inputs,...}:{imports=[inputs.jnsgruk.nixosModules.scrutiny];nixpkgs.overlays=[inputs.jnsgruk.overlays.additions];services.scrutiny.enable=true;}
The next time you rebuild your system, you should be able to browse to http://localhost:8080 and see some hard drive metrics!
This was a pretty quick exercise - I’d estimate at about 3 hours in total. No doubt I will find some bugs, but already in my mind are the following future improvements:
Add some more tests that exercise more of the config options
Enable notifications configuration in the module
Submit the packages/module to the upstream or to nixpkgs
I also need to go and investigate this rather sad looking hard disk…
That’s all for now! Thanks for reading if you got this far!